
Operations & Logs
Applicable roles: Administrator
Prerequisites: Signed in with an administrator account
This guide covers three areas: Usage Overview (how much is being consumed), System Logs (who did what), and Extension Settings (attaching sub-applications).
1. Usage Overview
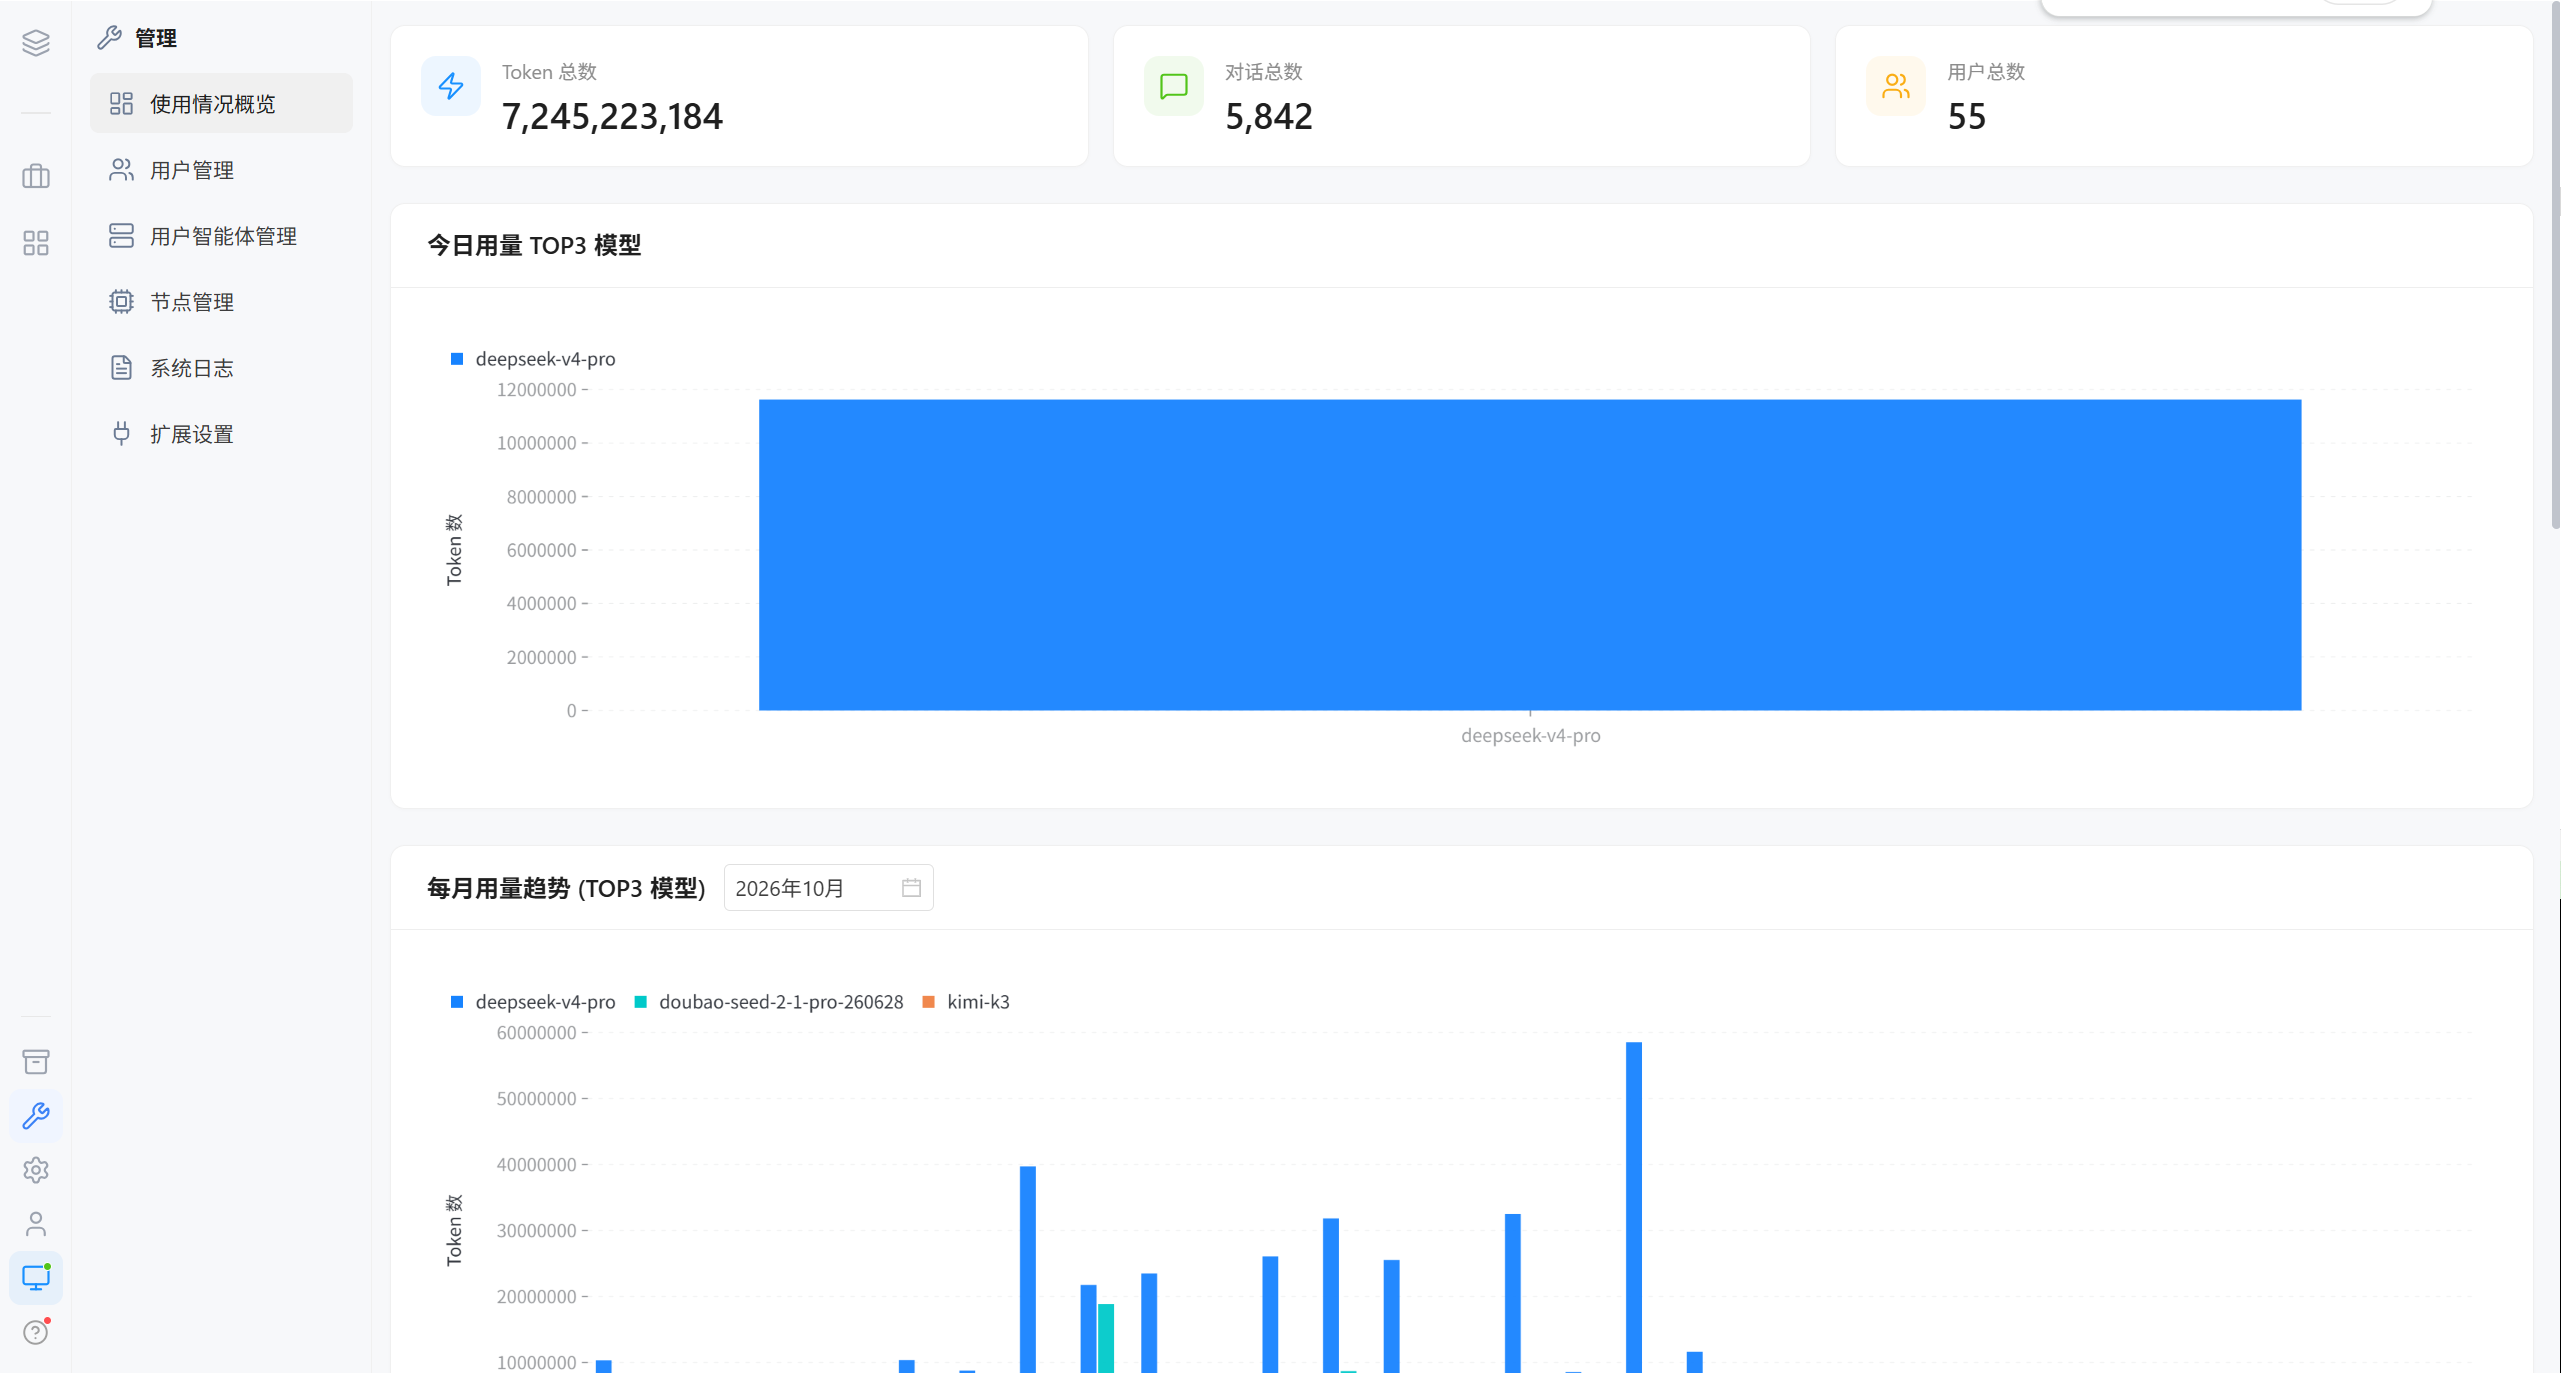
1.1 Core Metrics
| Metric | Definition |
|---|---|
| Total Tokens | The cumulative number of Tokens consumed by the platform |
| Total Conversations | The cumulative number of sessions |
| Total Users | The number of registered users on the platform |
1.2 Usage Distribution
| Area | Description |
|---|---|
| Today's usage TOP3 models | The top three models ranked by Token consumption |
| Monthly usage trend (TOP3 models) | Trends shown by month, with the Y axis representing the number of Tokens |
| User usage list | A paginated list showing each user's group, total Tokens, and total conversations |
Tip · The statistical dimension is the number of Tokens, not the number of requests. A single conversation with a long context consumes significantly more Tokens than a short conversation, so read the rankings together with the total conversation count.
1.3 Investigating Usage Anomalies
| Symptom | Investigation direction |
|---|---|
| A user's Token count is abnormally high | Look at that user's session list for runaway long conversations or looping tasks |
| A model's Token share is too high | Confirm whether the default model was set to a high-priced model |
| Usage suddenly spikes in a given month | Check whether a batch of new users was onboarded |
2. System Logs
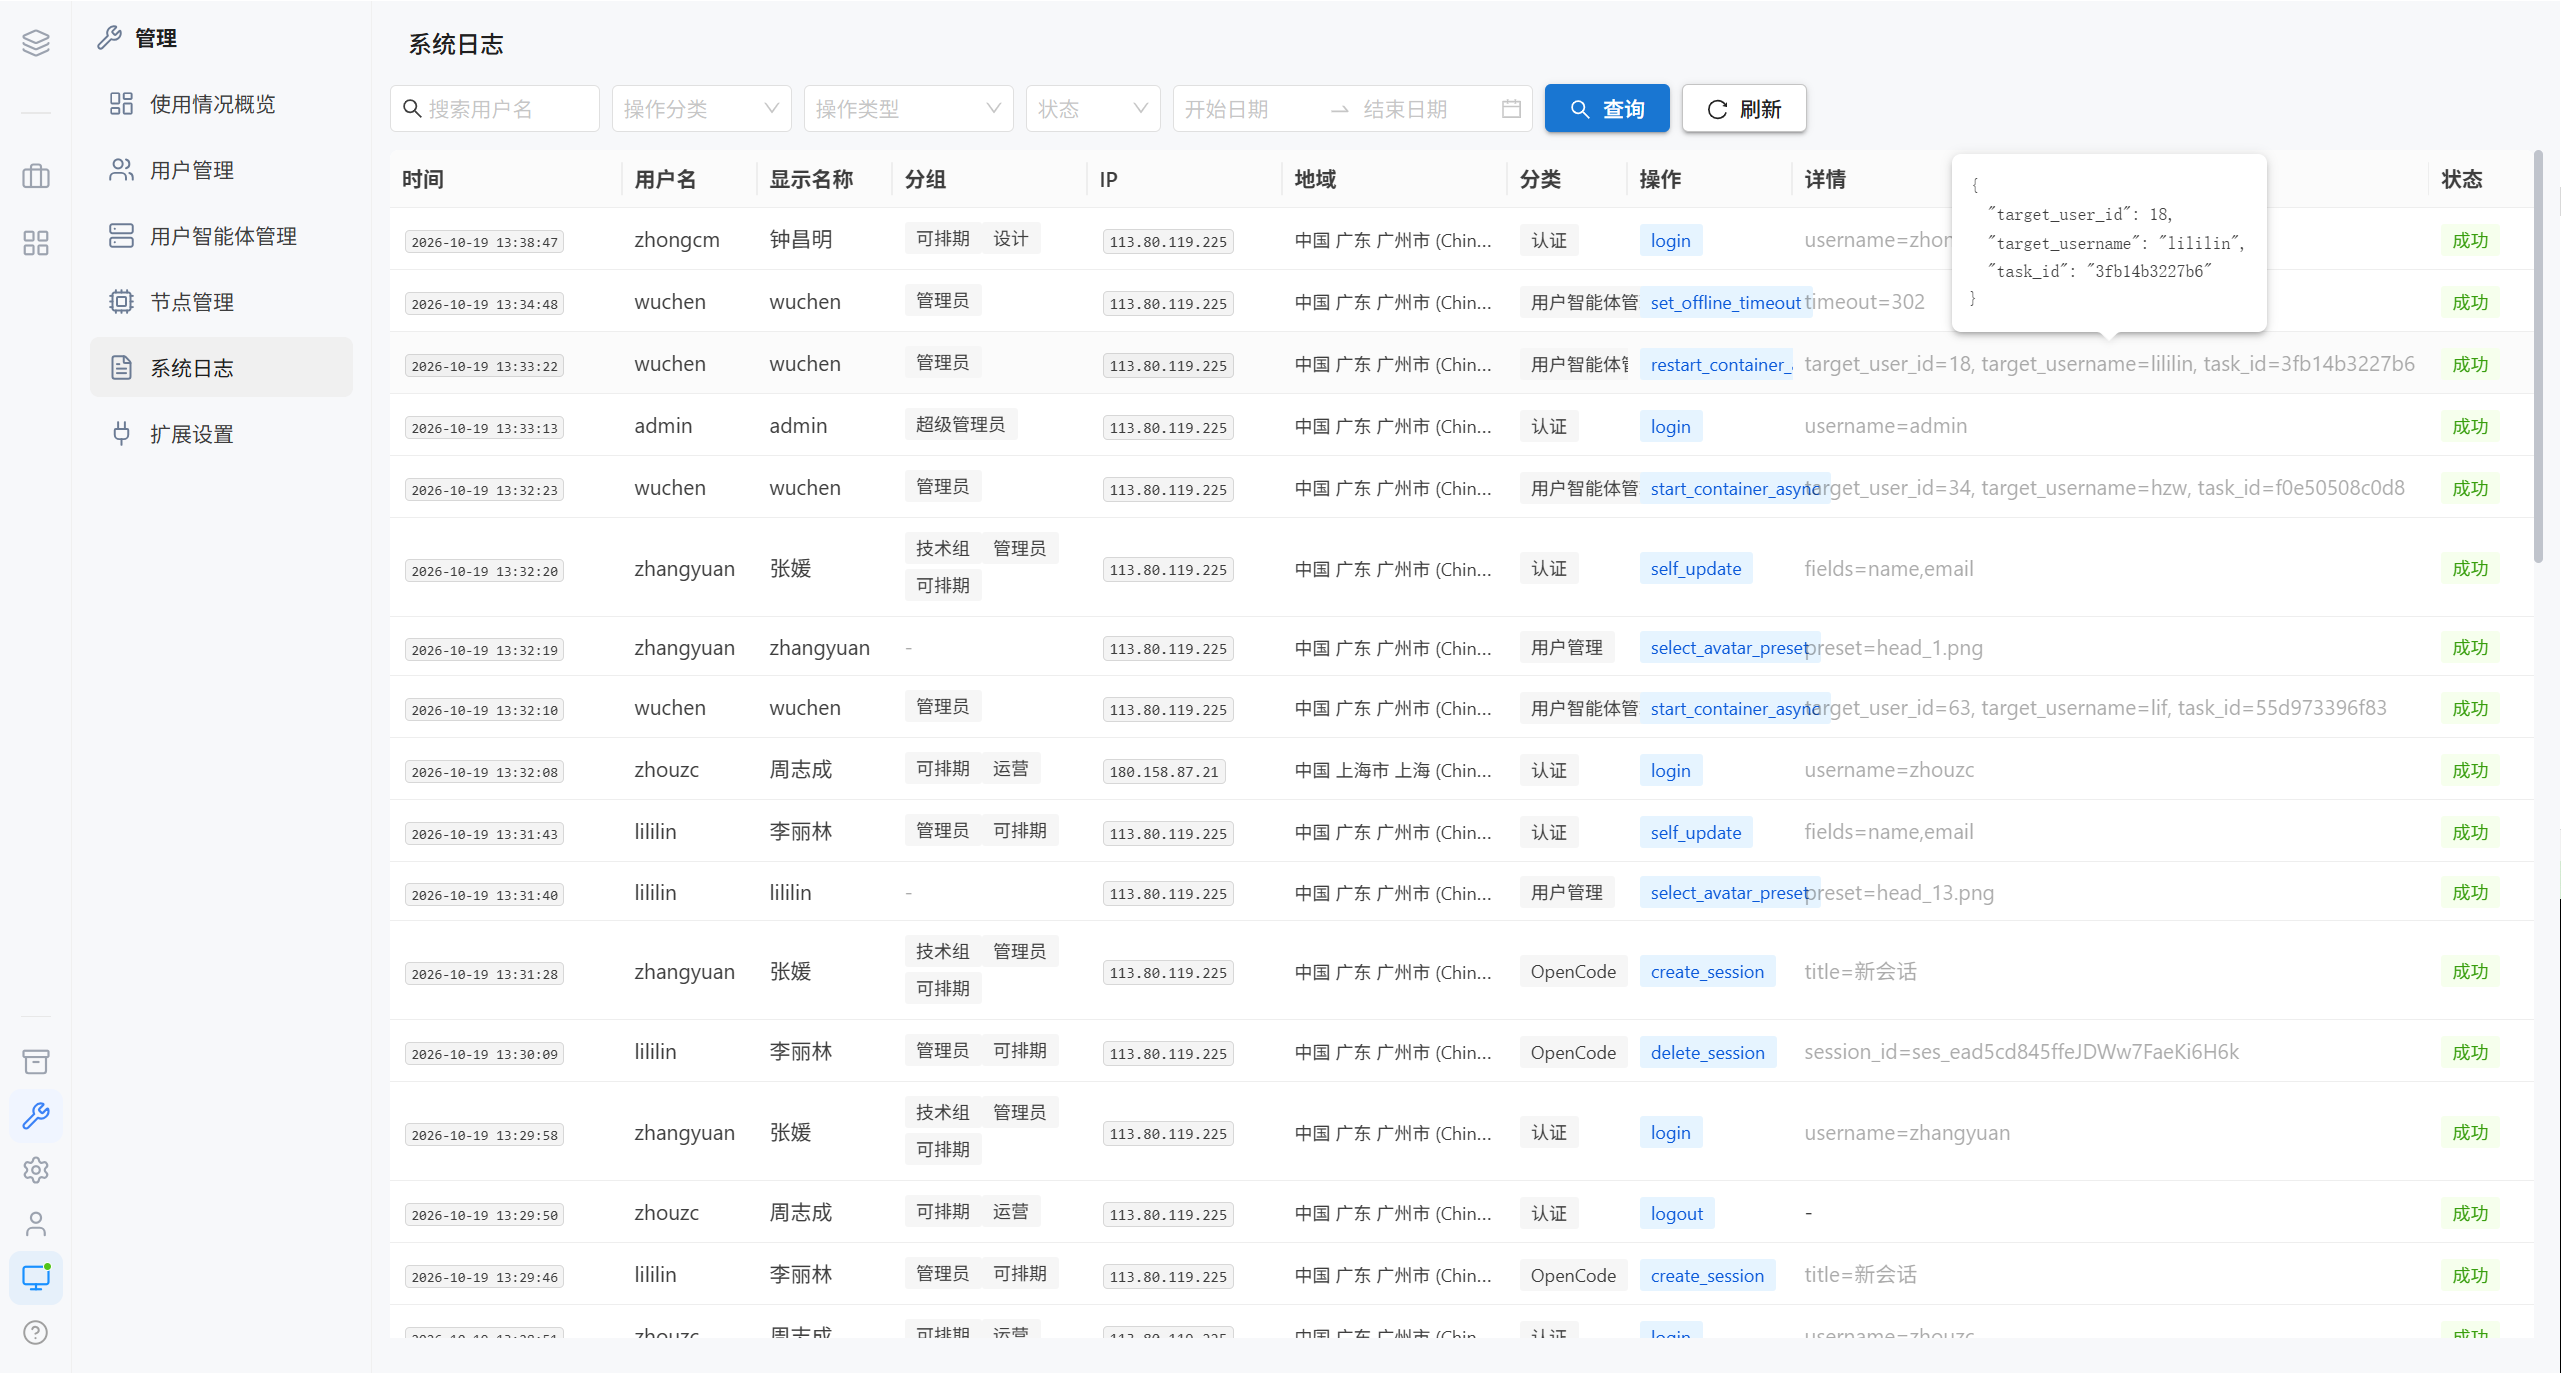
The platform keeps a complete audit trail of every key operation.
| Recorded field | Description |
|---|---|
| User | The operator |
| User group | The operator's group at the time |
| Source IP | Client address |
| IP location | The resolved region |
| Category | Operation category (login, container, assets, configuration, etc.) |
| Action | The specific operation |
| Details | The operation content in JSON structure |
| Status | Success / failure |
| Error message | The reason when the operation failed |
| Time | Precise to the millisecond |
2.1 Multi-dimensional Filtering
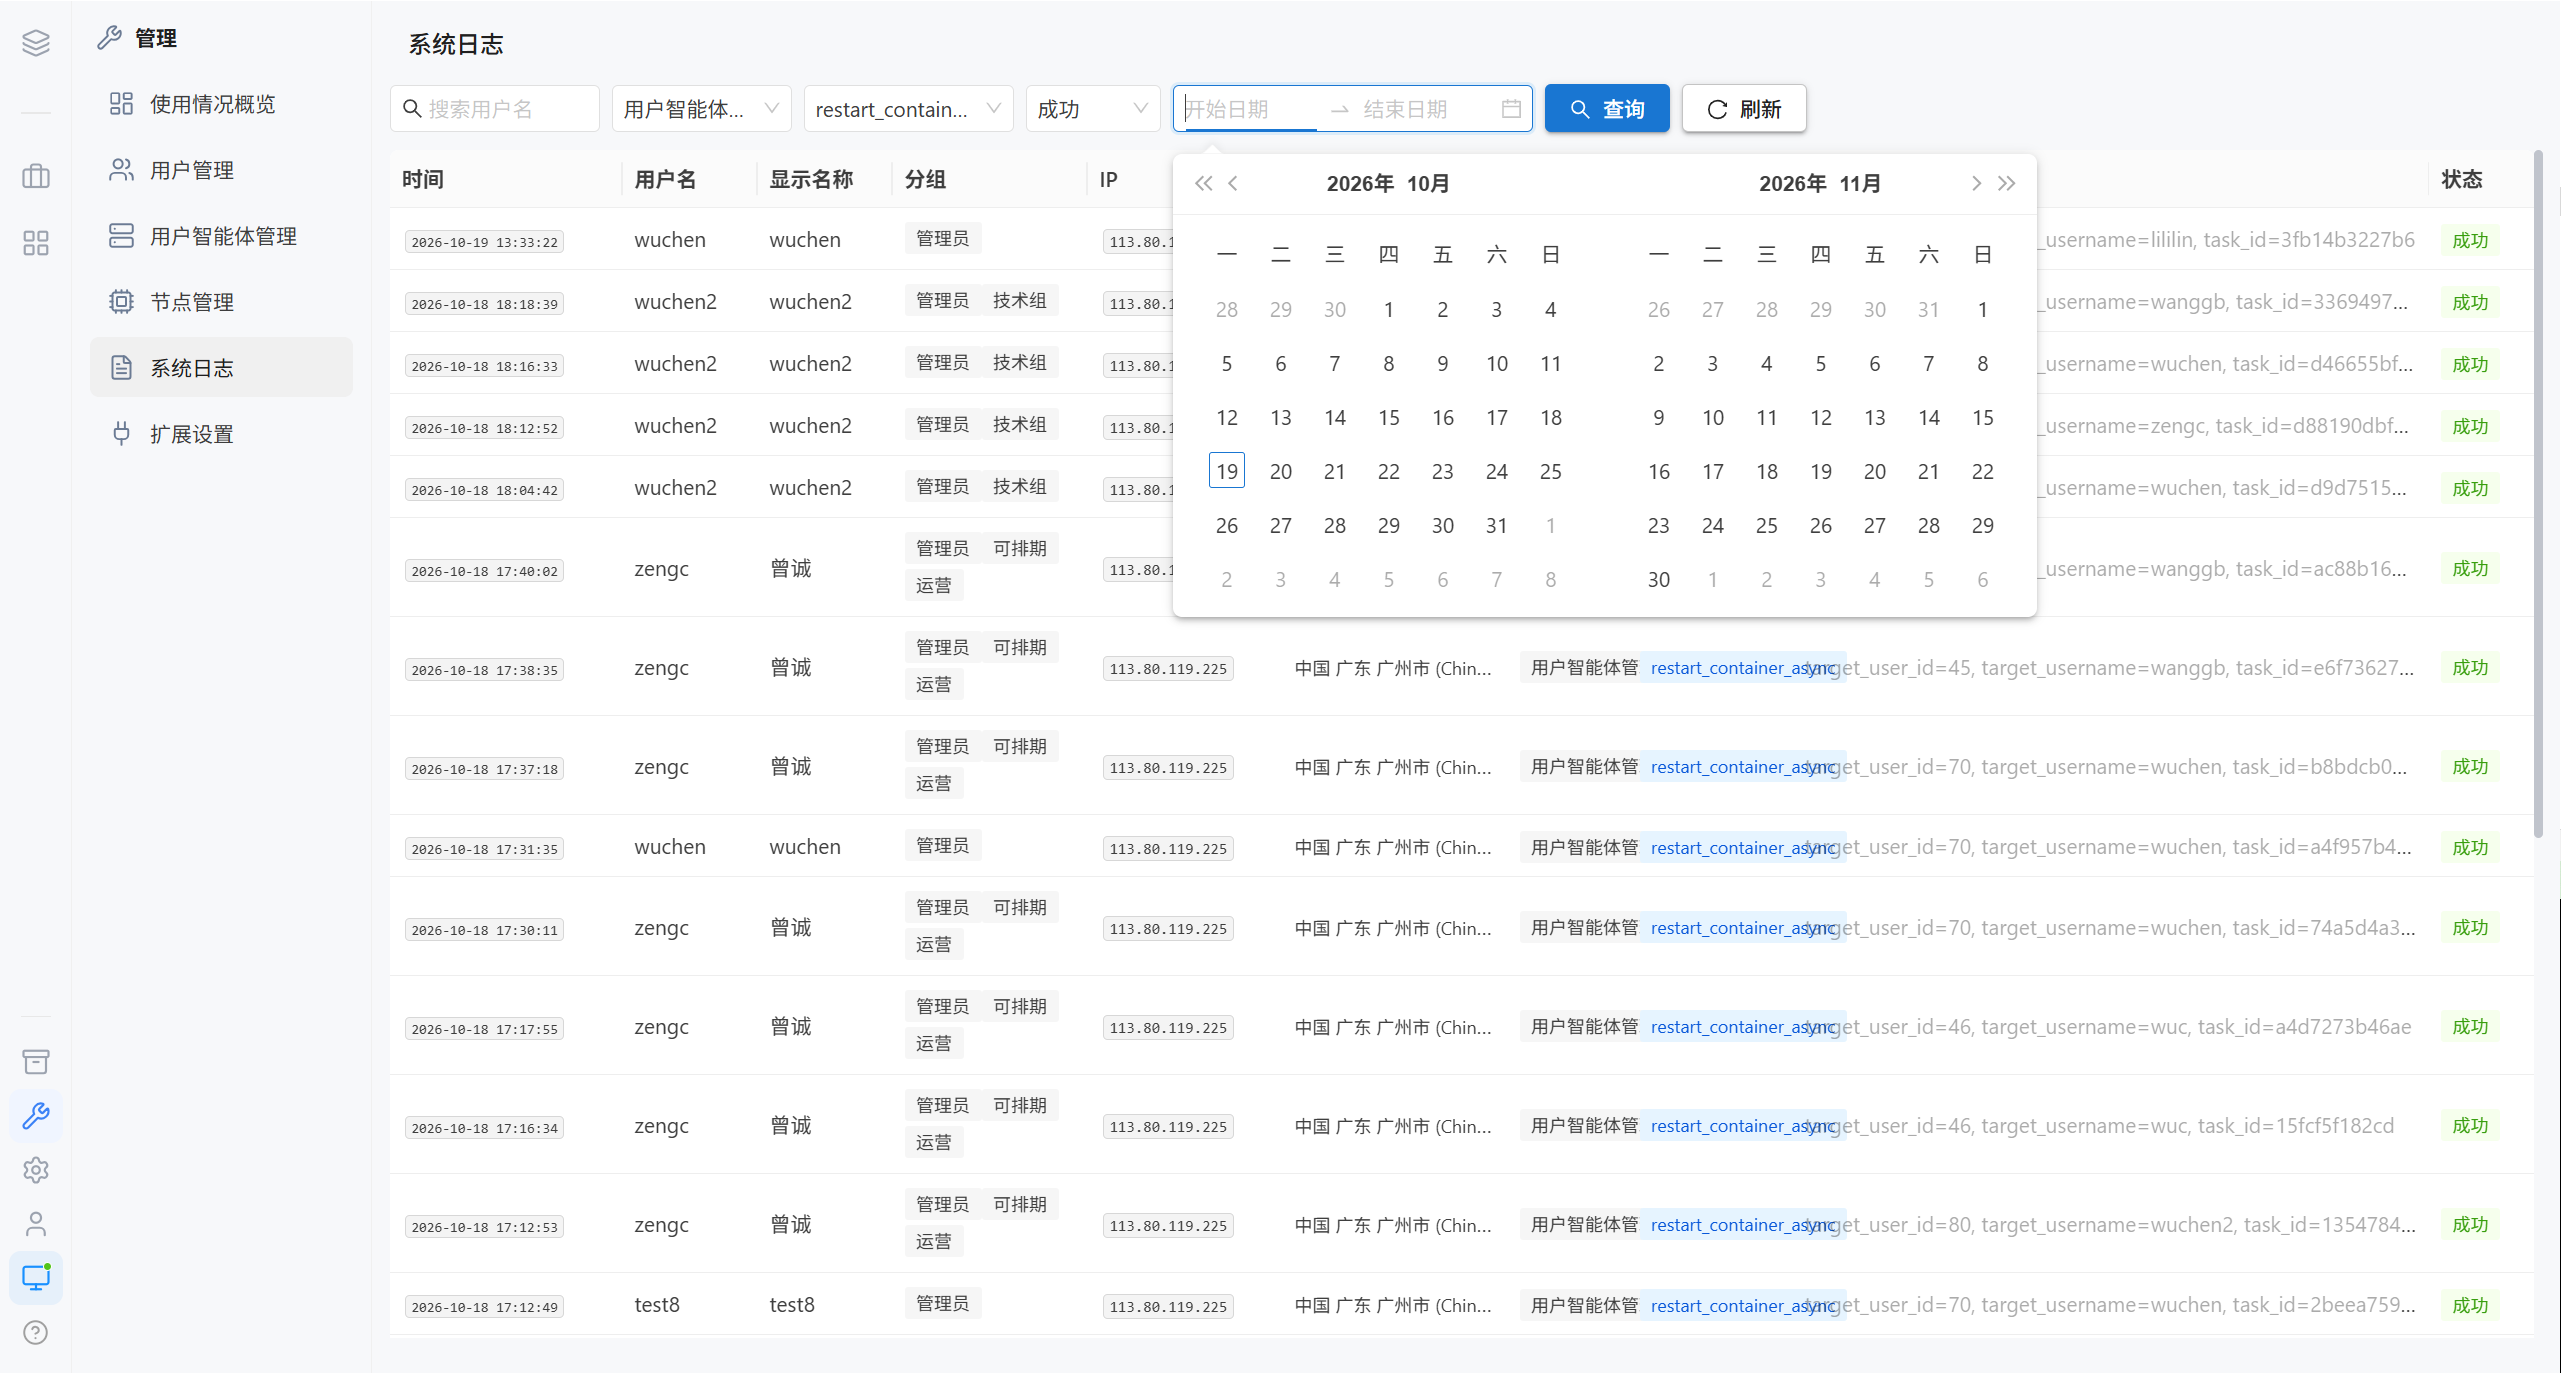
You can combine filters across the following dimensions:
| Dimension | Description |
|---|---|
| User | By operator |
| Category | By operation category |
| Action | By specific action |
| Status | Success / failure |
| Source IP | By client address |
| Location | By region |
| Time range | By start and end time |
Tip · When troubleshooting, first filter by "Status = failure", then narrow down by time and user; usually one or two steps are enough to locate the problem.
2.2 Typical Investigation Scenarios
| Question | Filter path |
|---|---|
| Who changed the model provider configuration | Category = configuration, action = update, aligned with the time of the change |
| Whether a user's account was ever reset | User = the target user, action = reset password |
| Where the abnormal login in the middle of the night came from | Status = failure, source IP is not the local machine |
| Who deleted a file | Category = file, action = delete |
3. Extension Settings
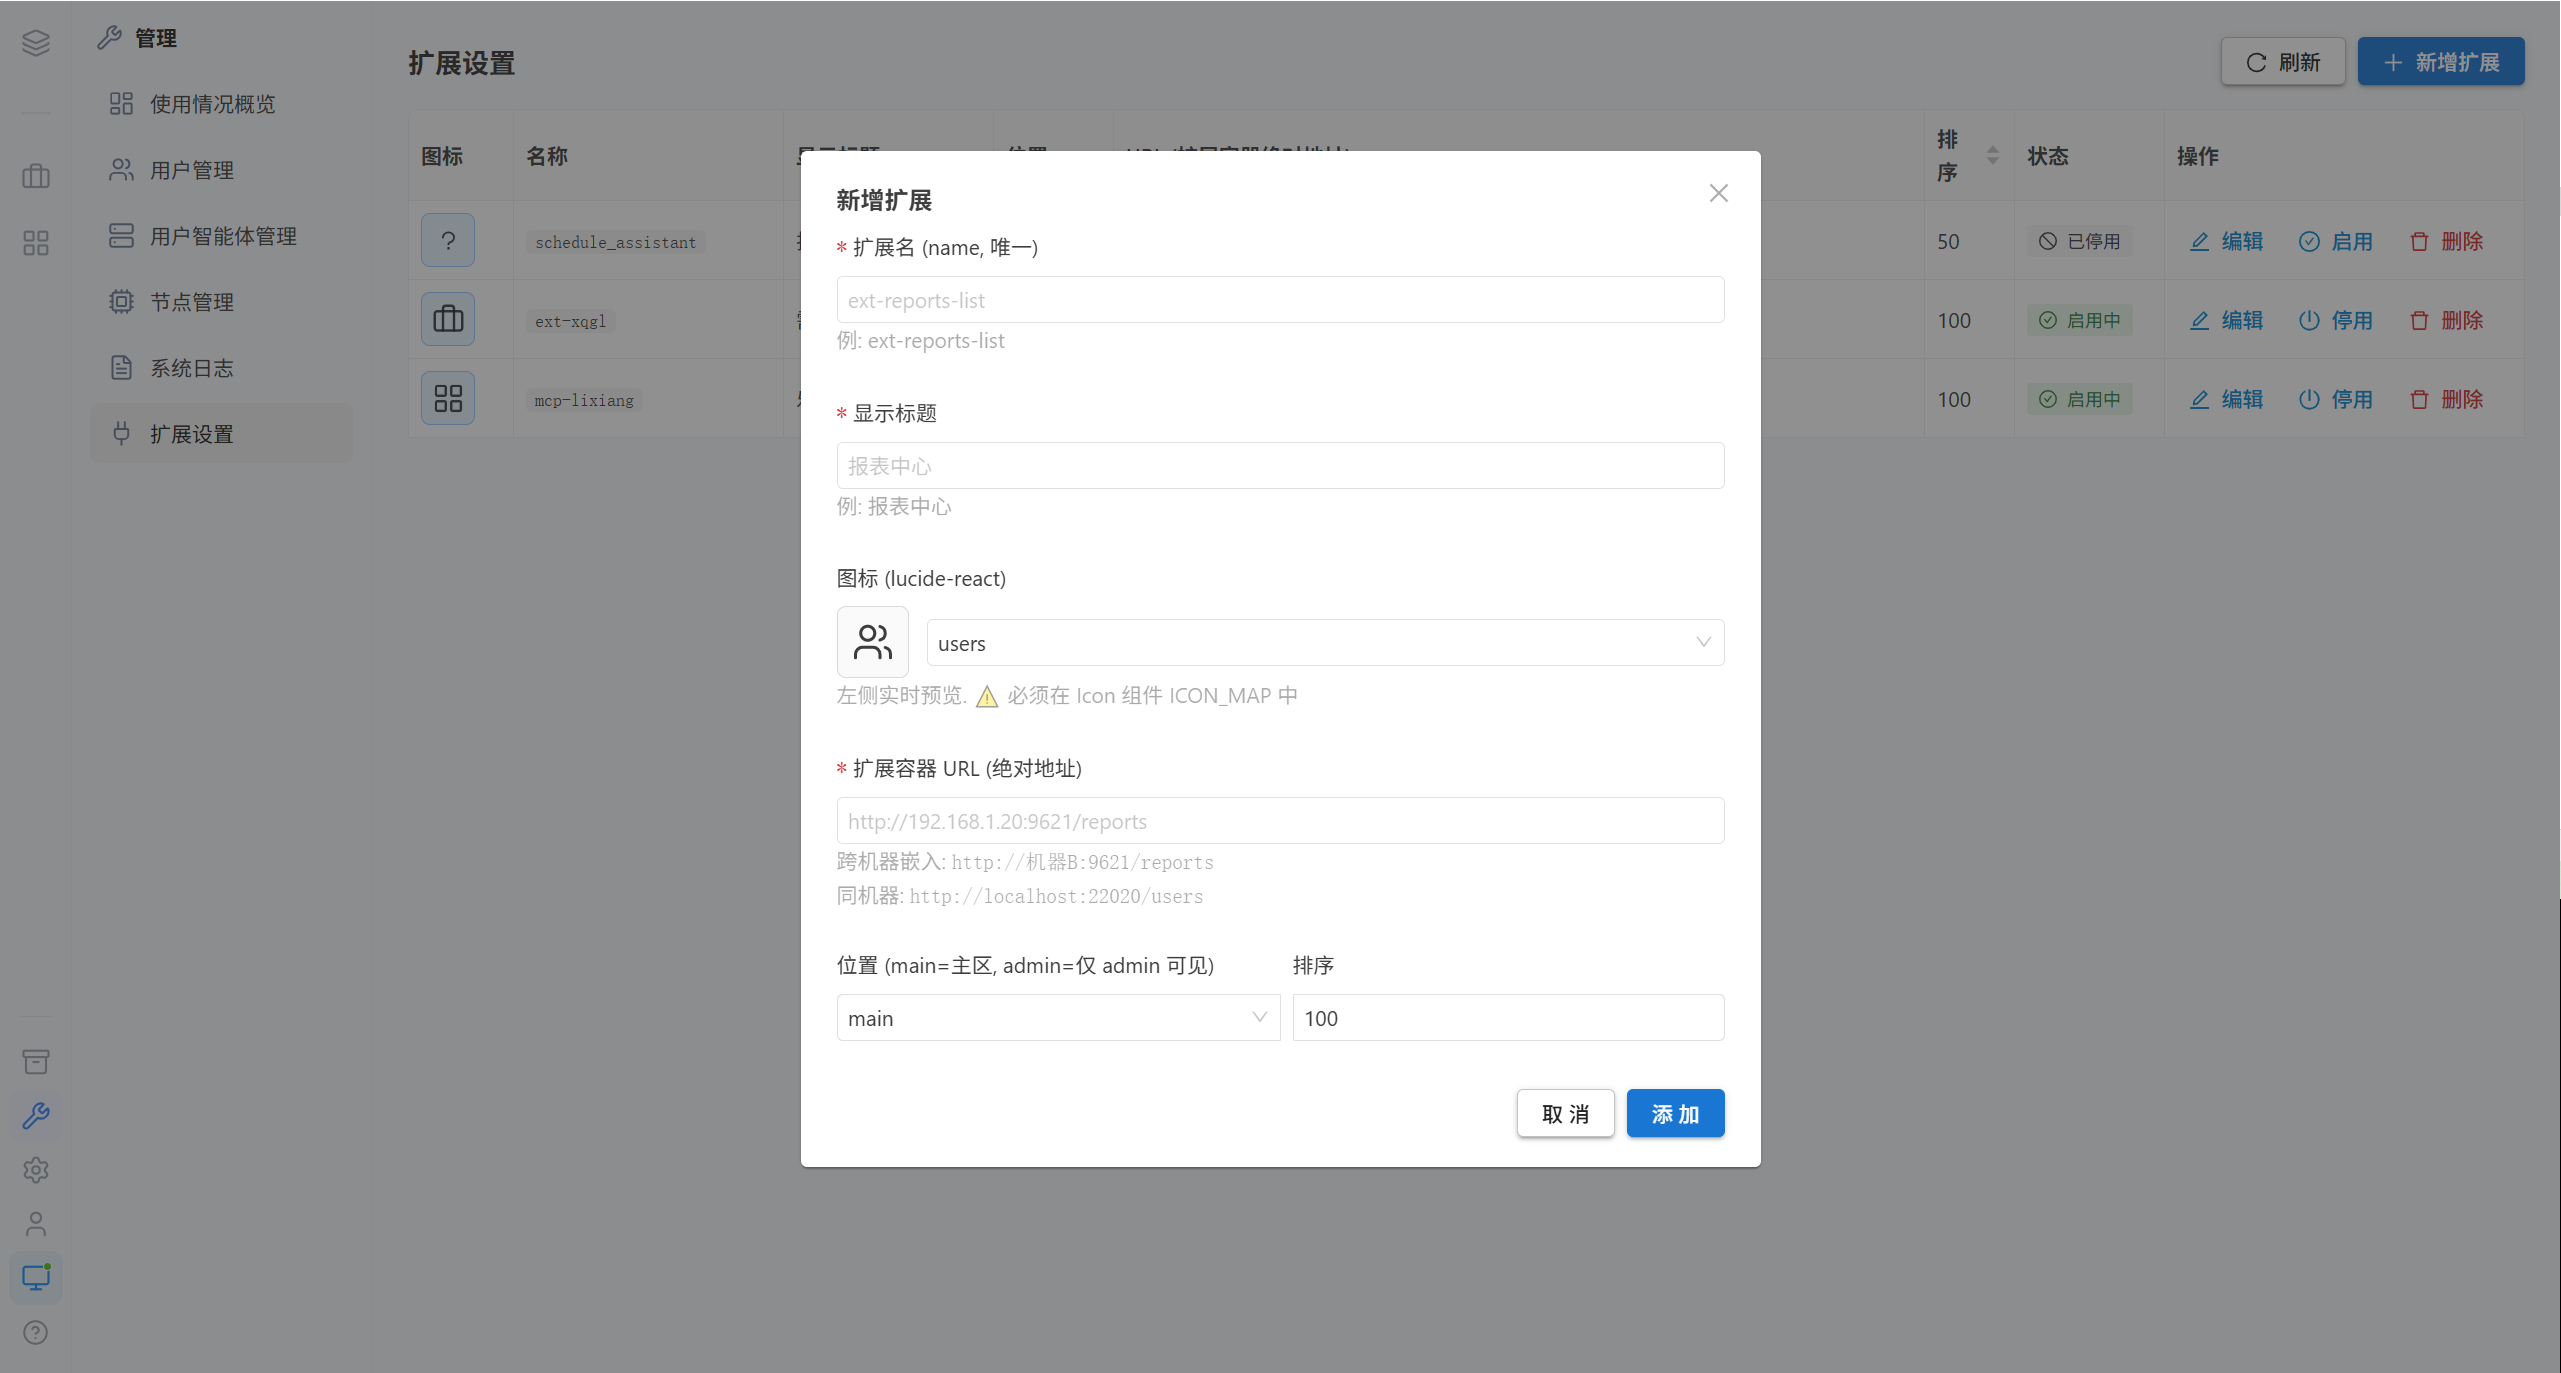
An extension is a third-party sub-application embedded into the platform as an iframe. Once registered, an icon appears in the middle of the left navigation bar.
Each row in the extension list corresponds to a registered extension:
| Field | Description |
|---|---|
| Icon | The icon displayed on the navigation bar |
| Name | The extension identifier, which determines the access path /ext/<name> |
| Display title | The name shown on the navigation bar and the hover tooltip |
| Position | The grouping position of the icon within the navigation bar |
| URL | The full address of the sub-application, it must be an absolute address |
| Sort order | The display order on the navigation bar, smaller values come first |
| Status | Enabled / disabled |
3.1 Add an Extension
| Field | Required | Description |
|---|---|---|
| Name | ✅ | Unique identifier, lowercase English is recommended |
| Icon | ✅ | Icon identifier |
| Title | ✅ | Display name |
| URL | ✅ | Sub-application address, it must be an absolute address |
Note · The URL must be an absolute address (with
http://orhttps://), otherwise the extension page will be blank.
3.2 Enable, Disable, Edit, and Delete
| Action | Effect |
|---|---|
| Enable | The icon appears on the navigation bar, visible to everyone |
| Disable | The icon disappears and pages that are already open are no longer available |
| Edit | Changes to the name, icon, title, and URL take effect after saving |
| Delete | Removed from the list. The extension container itself is not deleted, only the registration is canceled |
Tip · Extensions are deployment-level configuration; the applications registered differ between environments, and the specific list is maintained by the deployer. For how users use them, see Extension Applications.
4. FAQ
| Symptom | Cause | Resolution |
|---|---|---|
| The usage overview has no data | No conversations have taken place yet | Data only appears after normal use |
| A user ranks abnormally high | Long conversations or looping tasks | Read it together with the conversation count |
| A certain operation cannot be found in the logs | That operation is not within the audit scope | Refer to the "Category" list |
| The extension page is blank | The URL is not an absolute address, or the sub-application service is unreachable | Edit extension |
| The extension cannot be seen on the navigation bar | It is not enabled | Enable extension |
| The extension icon does not refresh | Frontend cache | Refresh the page; changes to the extension list actively trigger a reload |
5. Related Pages
| Page | Contents |
|---|---|
| Extension Applications | Using embedded third-party sub-applications on the user side |
| Users & Permissions | Auditing group and user operations |